- Methodology
- Open access
- Published:
Using Google Earth™ and Geographical Information System data as method to delineate sample domains for an urban household surveys: the case of Maroua (Far North Region-Cameroon)
International Journal of Health Geographics volume 18, Article number: 22 (2019)
Abstract
Background
Getting a random household sample during a survey can be expensive and very difficult especially in urban area and non-specialist. This study aimed to test an alternative method using freely available aerial imagery.
Methods
A gridded map and random selection method was used to select households for interviews. A hundred numbered of points were put along the edges of an updated map of Maroua. Then two numbers were randomly draw at a time and a line was drawn between those two numbers. A lot of different kinds of shapes of different sizes obtained were numbered. Ten shapes were randomly draw and the one selected were considered as ‘neighbourhoods’. A grid of 30 m × 30 m was drawn over each and then numbered. 202 grids considered here as households were randomly selected from the ten neighbourhoods for interviews.
Results
Out of 202 households visited, only 4 were found to be something other than a house. In addition, 30 sampled households (14.85%) were abandoned or the occupants had relocated elsewhere. This method resulted in an accuracy level of 72%, its advantage is the ability to generate efficient random sample at relatively low cost as well the time required.
Conclusions
The method proposed in this study was efficient and cost-effective when compared to the infield generation of a household inventory or Global Positioning System (GPS) tracking of households. It can then be used by researchers in low-incomes countries where funding for research is a challenge. However, this method needs to train the investigators on how to use the GPS.
Background
As the world population continues to grow, an increasing number of people are moving into cities with the hope of securing better living conditions, good quality of education and greater economic opportunities. Globally, today, 55 percent (%) of the world’s population lives in urban areas, a proportion that is expected to increase to 68% by 2050 [1]. Urban population in Cameroon was reported at 54.94% in 2016, according to the World Bank collection of development indicators, compiled from officially recognised sources. Indeed, it appears that cities thus become the living environment of more than half of the world population.
Urban lifestyles and the increasing diversity of urban conditions have not only created new social hierarchies and cultural rules. They have also contributed to the development of a new set of roles for health care systems and the evolution of demand models for health and other resources within and between cities. Indeed for a number of reasons, city dwellers—especially those in low– and middle-income nations—are especially vulnerable to the health impacts of climate change [2]. Thus, the challenge for researchers is to analyse the complex relationships between urbanisation and health, to explore new health challenges under conditions of pervasive urbanisation, to identify universal commonalities and local specificities in the urban experience of health, in the context of globalisation and to recognise the growing interdependencies between far-flung cities [3].
A remarkable amount of research has been conducted by several disciplines, including public health, urban planning, natural sciences or epidemiology, on the potential associations between urban areas and health or well-being [4]. To do such research, it is important to make surveys.
Studying the social factors and especially those that influence the health status of the population is one of the most important issues of sociological surveys today. This state is reinforced in urban areas where it is known that, the study of spatial disparities in health is rather complex because it is influenced not only by factors which are specific to the individual but also to a whole group of others which mount in socio-economic, demographic and political environment [5]. In addition, the analysis of the impacts of environment as well as health phenomena must be done in the city because of their growing dynamics and the development that still does not follow that dynamics, expose the populations to many unexplored risks. To identify these risks, researchers need relatively reliable data collection tools which combine both cost-effective results and affordable costs. Indeed, according to Kah and Pruvot [6], one of the main sampling constraints for ‘a geographer’ is to bring out samples that are representative of the territory or society he is studying. These authors estimate that the use of original technique is necessary to reduce this gap. Because of the complexity of the survey, in many papers, the sampling methodology used is not well described [7,8,9,10].
Due to the significant population growth and subsequent occupation dynamics in most African cities, household surveys are particularly important. Indeed, household surveys are an essential option to overcome the lack of outdated, incomplete or inaccurate official data [11]. In fact, to conduct a census is quite expensive and requires a lot of time as well as the use of important human resources not always available [12]. For example, the last population census conducted in Cameroon took place in 2005 and the results were published after 5 years in 2010 [13].
Moreover, the scale of a town is rather rough if specificities and internal variations are identified. Therefore, the map is a tool of choice for sampling operations. In this order, satellite images and geographic information systems (GIS) provide many opportunities that make it possible to have a synoptic overview of the extent of a territory and an up-to-date map as well as a database. When the geographical aspect is integrated, it can be perceived that taking into account the spatial scale is very important when it comes to the study of urban behaviours related to health. Everything that would not have been possible with a simple conventional sampling method. In fact, spatial sampling is now a fundamental element of surveys in many disciplines [14]. In addition, the use of GIS today offers the possibility of having a free and easy access to geographic data. Among them, the Google Earth software makes it possible to carry out effective and inexpensive mapping approaches for developing countries [15]. The objective of this paper is to propose an alternative method of surveys which is inexpensive and simple using Google Earth and Geographical Information System data as an alternative to some outdated data.
Methods
Study site
This study was carried out from july to october 2014 in the Maroua towns which is the biggest town in the Diamare Division of the Far North Region of Cameroon. This Region is the most populated in the country after the Centre with around 3.5 million populations. Maroua is the chief-town of the Diamare Division with a surface area of 4665 km2 and is bounded to the South by the Mayo Kani division, to the North by Logone & Chari and Mayo Sava divisions, to the East by Mayo Danay and to the West by the Mayo Tsanaga. This Division had 784,910 inhabitants in 2013 with a density of 137.7/km2. The population of Maroua was 403,817 in the same year (Report of the Far North Regional Delegation of Economy, Planning and Regional Development, 2013 not published). Administratively, the city of Maroua covers three subdivisions: Maroua I, II and III. Geographically, the city of Maroua is located between latitude 10° to 13° North of the Equator and longitude 13° to 15° East of the Greenwich meridian (Fig. 1).

Location of Maroua in the Far North Region of Cameroon
The main asset of the city of Maroua which justifies this study is that Maroua is a cosmopolitan city grouping together several social groups that carry out various activities such as agriculture, breeding, trade, and crafts [16]. This diversity of the population is also due to the creation of Governmental University in 2008.
Just like the Far North region, the city of Maroua is characterised by a Sudano-Sahelian climate. This climate is marked by a dry season from October to May and a short rainy season from June to September. The average annual rainfall is about 700 mm. The thermal differences are significant, with extremes temperature ranging from 27 to 41 °C. The temperatures are generally low in the rainy season and the nights in the dry season (December–January). The relative humidity of the air is quite low and varies with altitude. It varies between 30 and 35%, whereas the potential evaporation is considerable, that is from 3500 to 3700 mm [17].
Project set-up
The methodological approach adopted was to make sure to have on the same medium, a faithful overview of the spatial distribution of households of Maroua. This required the establishment of a spatial data infrastructure, the collection of images and background maps from various sources, the delineation of spatial sampling units and the design of the survey. The following flowchart (Fig. 2) shows the methodological approach described in this section.
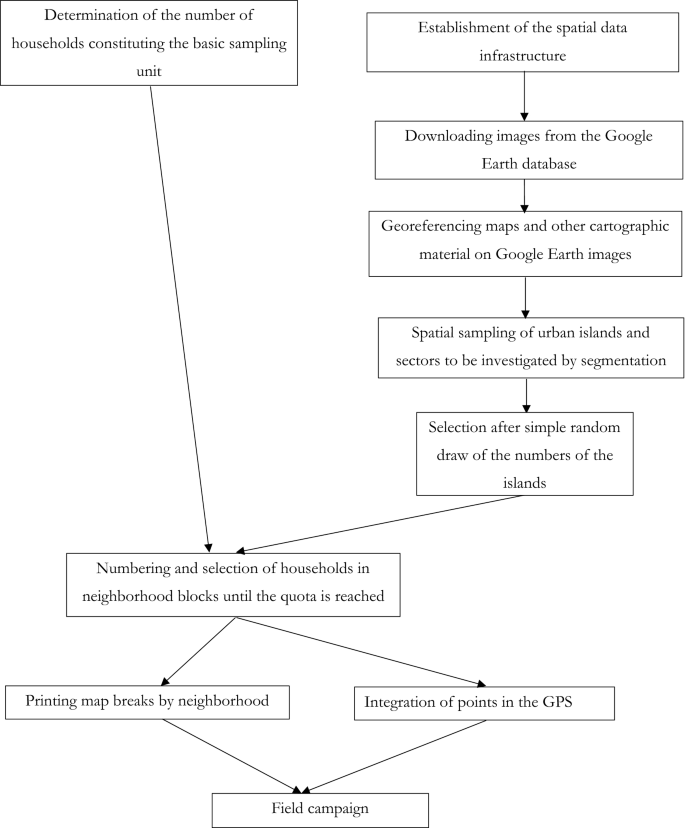
Overall methodological scheme of the study
Establishment of the spatial data infrastructure
The establishment of the spatial data infrastructure is the prerequisite [18, 19]. The process is being conducted to coordinate and monitor the exchange and sharing of geospatial data and services. The sampling strategy used in this study was adapted from the method described by Profitós et al. [20].
The images of the Google Earth database and other cartographic documents as data sources
To carry out this study, the Google Earth 7.1 software was used. The images from the Google Earth database are a viable alternative to provide a snapshot of the spatial pattern of a territory. The images offered by the software come from both satellites and aerial photography with a repeatability update ranging from 6 months to 5 years [15, 21]. This repetitive frequency of updating images over time makes them an effective alternative to old, non-updated data from official data collection agencies.
We started by updating the Maroua NC-33-6 topographic sheet at the 1/250 000 published by Army Map Service (S & H) in 1960. This topographic sheet was used as the basic cartographic infrastructure [22]. Similarly, the maps of a Non-Governmental Organisation that have worked in the city showing the location of neighbourhoods and interesting places have been used as a basis for the inventory of spatial configuration and neighbourhood distribution. To update this map, the images taken by the Digital Globe satellite on September 20, 2013 was downloaded from Google Earth 7.1 database. This operation consisted of projecting the scanned topographic sheet onto the downloaded images in order to match and georeference the immutable bitter points in the space (rivers, bridges, etc.) (Fig. 3). This process, which facilitated the delimitation of the city of Maroua, also enabled the different neighbourhoods to be identified with their names.

Delimitation of the study area. a Maroua and its peripheries; b scanned map of the city on satellite images; c delimitation of the study area
Selection of the proper survey sites
Spatial sampling of urban islands and areas to be surveyed
After this step, 100 points were placed along the edge of the map (25 equidistant points on each side) (Fig. 4a). These points were then randomly numbered from 1 to 100.

Neighbourhood delineation process. a Segmented border; b shapes of different sizes obtained after printing; c shapes numbered; d selected shapes used as ‘neighbourhoods’
Once the contours of the city framed and 100 points affixed, the technique used was to draw at random a couple of points. Indeed, by simple random sampling, two points on the existing 100 were drawn at the same time and a line connecting the two selected points was traced. A total of 20 pairs of points were drawn for this purpose. This allowed us to have several geometric figures of different size (Fig. 4b). All these figures were subsequently numbered randomly by a unique identifier (Fig. 4c).
The number of households constituting the basic sampling unit
Ten figures were then selected after a simple random draw using their numbers. These selected figures then constituted the ‘neighbourhoods’ (Fig. 4d).
In each ‘neighbourhood’, a grid of 30 m × 30 m was plotted as shown in Fig. 5. Indeed, according to Mayer [23] and Zhang [24], the buildings studied by remote-sensing in some urban areas in Africa have an average surface over 100 m2. The surface defined in this study will allow precise detection (which is close to the realities of our study area), knowing that in our study area a household can contain several concessions and this especially in polygamous households [25]. So in this context, a grid corresponds to a household. All grids obtained in each ‘neighbourhood’ were randomly numbered, except those that were located on roads, water points or bridges. Each limited urban islands have been numbered and codes were reported and processed with the software R (versions 3.1.3) [26]. Then, this resulted in a simulation of the random draws by the function ‘sample’ and thus to select the principal islands of the sector to survey. These numbers were used to randomly draw these grids (Fig. 5).

Sampling of grids and households to be surveyed. a Example of grids drawn in a ‘neighbourhood’; b numbered grids
Input data collection and preparation
Finally, in each neighbourhood, a well-defined number of grids was selected taking into account the total number of households to be surveyed (200), the total number of grids in the 10 selected neighbourhoods and the number of grids in this neighbourhood. Therefore, for a quarter name ‘A’ number of select grid was:
Once the grids were drawn, they were randomly drawn again. The coordinates of the parcels thus provided were recorded in ‘Kml’ format. Then, using the QGis version 2.6.1 software [27], the KML files were converted to ‘GPX’ file and then imported into a Garmin Etrex H branded GPS (precision 10 to 2 M, acquisition Tedm: 3 to 39 s).
Results
In-field assessment of accuracy of this methodology
To achieve our goal, a survey sheet with open-ended questions that focused on a number of topics was used with entries where the GPS coordinates should be noted.
On the field, the investigators were two, a man and a woman for the concerns of representativeness of the sexes. The investigators were provided with printed Google Earth images on paper indicating the sector of investigation in question. The main access routes were marked to avoid location problems. Upon arrival, the investigators had to go to the first household where the arrow of the previous steps was pointing.
In the case where the concession was empty, the investigators were instructed to go to the nearest concession adjoining the previous and located on the same axis. This procedure was also used in case of a refusal by the respondents.
Over a month, enumerators visited 202 households. Of these 202, only four were found to be something other than a house. In addition, 30 sampled households (14.85%) were abandoned or the occupants had relocated elsewhere. This method resulted in a 78.37% accuracy level.
Figure 6 shows the households surveyed in the urban area of Maroua.

Distribution of surveyed households
Distribution of surveyed households
The Tables 1 and 2 summarises the field surveys and their purpose in relation to in relation to the scheme established before the survey.
Discussion
The methodology used reveals several advantages by enabling the use of combined GPS tools and the use of Google Earth™ imagery. In fact, it emerges from the survey strategy that 78.37% of the initial spatial sampling has been achieved and have been investigated as originally defined. As a result, more than a third of the sample frame was reached without any considerable effort from the investigators. At the location planned, the surveys were carried out. For the remaining 14.85%, with only 9.60% having declined to take part in the survey exercise, which are independent of the sampling plan, they come mainly from the urban dynamics of African and Cameroonian cities that are undergoing mutations and also from the respondent’s willingness to respond. However, the investigators were only required to follow the departure protocol, which was designed to help them redirect themselves to the nearest door. These statistics inform about the importance and contribution of the method used and several benefits that have been observed.
Indeed, the low percentage of no response indicates that little bias can be introduced in the information collected due to the lack of information like in previous studies [28,29,30]. This is a real asset in the field of health surveys, where traditional socio-demographic observation tools such as exhaustive censuses and probability sample surveys are difficult to be implemented and do not adequately meet the needs of research and urban planning [31].
Another strength of our approach comes from the fact that it saves time and make it easier to manage time effectively. The procedure for designating the neighbourhood and house to be investigated is done before surveys. As in analogous studies [14, 28, 32], the time taken to prepare the sample prior to the field trips guarantee a speed of execution once it has been implemented. In epidemic areas, this methodology appears to be ideal in the situation where there are no survey databases [33,34,35]. Indeed, the cost of data collection and the length of time required to conduct traditional censuses limit the frequency of surveys to about 10 years, which is insufficient for monitoring rapidly growing urban populations or health issue [31]. This would compromise any chance of implementing solutions to urgent health problems. This is a significant gain in time for the continuity of investigation and its implementation by field investigators.
In addition, the survey manager, with the use of GPS and printed maps, has an overview of the evolution of data collection in the field and can if necessary change the sampling design when he when ever need arises. This combination of GPS receiver and printed maps allow to overcome common measurement errors in previous studies [28, 36,37,38].
The planner has the opportunity to know if his sampling plan is followed. This is a significant contribution in the control and exploitation of data [32]. This also clearly demonstrates the reliability of the data collected in this study. Throughout the survey progress, the survey planner gathers the information collected in the field and can see the evolution of the surveys at the end of each day. As a result, the data collected is more reliable because an overview and a visual validation of the progress of the surveys can be made.
As Shannon et al. [36] stated that, the images from the Google Earth database proved accurate and with a spatial resolution that allowed the interviewers to find themselves quite easily indeed, the scenes were taken from the images of the Digital Globe constellation that offers a metric resolution. Pearson et al. [39] and Lin and Kuwayama [40] have also corroborated this state in their random surveys where the method used was also quite inexpensive. In fact, traditional methods of spatial data collection require heavy investments for census mappings prior to any intervention on the ground. Thus, it avoids repeated round trips in the field before the real survey and also avoid an increase in the budget by the recruitment of people specialised in mapping as well as lead surveyors.
However, this method nevertheless has some limitations. It should be noted that the images from the Google Earth database, although they provide a very accurate overview of the spatial configuration and distribution of households, it only give a view to a specific date. Indeed, the time of available image updates and the start of the surveys can affect the conduct of field investigations. During the fieldwork, the percentage of the habitats that were supposed to be households were found not occupied. This is due to the fact that the city of Maroua is a city with a hight rate of urban dynamic and development. The process of urbanisation has been accelerated in recent years and large parts of the city are filling up rapidly [8]. However, the images acquired from the Google Earth database have an update period. Similarly, between acquisition, printing and fieldwork, a certain amount of time is consumed.
It is also important to mention that the procedure prior to the field trip, from the setting up of the spatial data infrastructure to the selection of survey locations, is done manually. This implies that the survey planner must have a fairly reliable knowledge of the locations where the survey will be planned. Similarly, these preliminary procedures require time for the preparation of the projected maps. However, this time is quickly recovered with the reliability and speed on field trips.
In order to use this method efficiently the investigators most be drilled on data collection technique using field tools like the GPS. In fact, the investigators were trained to read the maps and to identify the different landmarks in the field. Similarly, they were trained to find previously saved waypoints. In the field, the investigators sometimes ended up in unoccupied habitats or households that refused to give answers to their questionnaires. In this case, the investigators were recommended to adapt the sampling plan by accessing the nearest household. This approach was a challenge for the investigators at the beginning in the sense that they had to judge by themselves and choose the household to be surveyed. Nevertheless, this work is a step in the direction of the reduction of uncertainty encountered in spatial analysis particularly in geography and GIS science [30].
On the other hand, it appears that this method can be even more valued for repeated demographic surveys. In fact, in addition to the ease with which the method can be approached more easily by surveys, this method makes it possible to overcome the time constraint that affects single-pass surveys. Similarly, with a georeferenced database, investigators have accurate spatial coordinates of their sample and can more easily intervene in the field.
Conclusion
In developing countries, spatial sampling is subject to many challenges. Researchers need reliable data collection tools that combine both cost-effective results and affordable costs. Therefore, in this article, we have proposed an alternative method, which is both cost-effective and easy to be implement, and which could be an alternative to some outdated data when compared to the infield generation of a household inventory or GPS tracking of households. However, this method needs to train the investigators on how to use the GPS. The methodology shows the contribution of free Geographical Information Systems in data collection, which is intended to be quite representative for the city of Maroua. With a data collection accuracy of more than 78% of the starting quota that was found to be interested in more than one way. The need to study social factors in particular those that influence the health status of the population is nowadays one of the most important issues in sociological surveys, so they need to have a spatial sampling frame at a lower cost. All these shows that this methodology can really serve as a decision-making tool in developing countries and for low-cost research.
Availability of data
The datasets used/or analysed during the current study are available from the corresponding author on a reasonable request.
Abbreviations
- GPS:
-
Global Positioning System
- GIS:
-
geographic information system
- °C:
-
degrees Celsius
References
United Nations (UN), (DESA) DoEaSA. World urbanisation prospects: The 2014 revision. 2015 2015. Report No.: Contract No.: ST/ESA/SER. A/366.
Barata M, Ligeti E, Simone GD, Dickinson T, Jack D, Penney J, et al. Climate change and human health in cities. In: Rosenzweig C, Mehrotra S, Hammer SA, Solecki WD, editors. Climate change and cities: first assessment report of the urban climate change research network. Cambridge: Cambridge University Press; 2011. p. 179–214.
ICSU. Report of the ICSU planning group on health and wellbeing in the changing urban environment: a systems analysis approach. Paris: International Council for Science; 2011.
Krefis CA, Augustin M, Schlünzen HK, Oßenbrügge J, Augustin J. How Does the Urban Environment Affect Health and Well-Being? A systematic review. Urban Sci. 2018;2(1):21.
Kassié D, Roudot A, Dessay N, Piermay J-L, Salem G, Fournet F. Development of a spatial sampling protocol using GIS to measure health disparities in Bobo-Dioulasso, Burkina Faso, a medium-sized African city. Int J Health Geogr. 2017;16(1):14.
Kah E, Pruvot M. Maximiser la représentativité de groupes dans un échantillonnage spatial. Cybergeo: European Journal of Geography. 2002 (Systèmes, Modélisation, Géostatistiques, document 224, mis en ligne le 23 septembre 2002).
Noatina B, Kagmeni G, Mengouo MN, Moungui HC, Tarini A, Zhang Y, et al. Prevalence of trachoma in the Far North region of Cameroon: results of a survey in 27 Health Districts. PLoS Negl Trop Dis. 2013;7(5):e2240-e.
Zieba FW. Immigration, croissance démographique et dynamique urbaine au Nord Cameroun. Afr Popul Stud. 2014;28(3):1233–47.
Tidze VC, Ibrahim M, Issac T. Dynamics of household energy and cooking stoves in Maroua, Far North Region of Cameroon. J Scientific Res Rep. 2016;9:1–13.
Wanie CM. A survey of tuberculosis in the city of Maroua, Far North Region of Cameroon. E3 J Scientific Res. 2016;4(2):018–27.
Thomson DR, Stevens FR, Ruktanonchai NW, Tatem AJ, Castro MC. GridSample: an R package to generate household survey primary sampling units (PSUs) from gridded population data. Int J Health Geogr. 2017;16(1):25.
Escamilla V, Emch M, Dandalo L, Miller WC, Martinson F, Hoffman I. Sampling at community level by using satellite imagery and geographical analysis. Bull World Health Organ. 2014;92(9):690–4.
NSI. Population and social affairs. Madrid: National Institute of Statistics; 2010.
Wampler PJ, Rediske RR, Molla AR. Using ArcMap, Google Earth, and Global Positioning Systems to select and locate random households in rural Haiti. Int J Health Geogr. 2013;12(1):3.
Kamadjeu R. Tracking the polio virus down the Congo River: a case study on the use of Google Earth™ in public health planning and mapping. Int J Health Geogr. 2009;8(1):4.
Madi OP, Bourou S, Woin N. Utilisations et importances socio-économiques du Moringa oleifera Lam. en zone de savanes d’Afrique Centrale Cas de la ville de Maroua au Nord-Cameroun. J Appl Biosci. 2012;60:4421–32.
Dassou EF, Ombolo A, Mboudou GE, Chouto S, Ambomo EB, Essi JMA. Caractérisation de la variabilité spatio-temporelle des précipitations dans la zone soudano-sahélienne du Cameroun au cours des cinq dernières décennies. Afr Sci. 2015;11(4):331–48.
Cooper AK, Rapant P, Hjelmager J, Laurent D, Iwaniak A, Coetzee S, et al. Extending the formal model of a spatial data infrastructure to include volunteered geographical information. In: 25th International Cartographic Conference (ICC 2011); 2011. Paris, France; 2011.
Yakubailik O. The Formation of Regional Spatial Data Infrastructure. J Sib Fed Univ Eng Technol. 2016;9:979–86.
Profitós JMH, Mouhaman A, Lee S, Garabed R, Moritz M, Piperata B, et al. Muddying the waters: a new area of concern for drinking water contamination in Cameroon. Int J Environ Res Public Health. 2014;11(12):12454–72.
Blog GE. About Google Earth Imagery; 2008. https://www.gearthblog.com/blog/archives/2008/02/about_google_earth_imagery.html. Accessed 20 June 2014.
The US Army Map Service c, cartographer NC 33-6 Maroua, Cameroon; 1966.
Mayer H. Automatic object extraction from aerial imagery—a survey focusing on buildings. Comput Vis Image Underst. 1999;74(2):138–49.
Zhang Y. Optimisation of building detection in satellite images by combining multispectral classification and texture filtering. ISPRS J Photogr Remote Sens. 1999;54(1):50–60.
Devaux N, Fotsing J-M, Chéry J-P. Extraction automatique d’habitations en milieu rural de PED à partir de données THRS. Cybergeo: European Journal of Geography. 2007 (document 388, mis en ligne le 12 juillet 2007).
Team, R. Developement Core. R: a language and environment for statistical computing. 313th ed. Vienna: R Foundation for Statistical Computing; 2016.
Team QD. QGIS geographic information system. Open Source Geospatial Foundation Project; 2016.
Haenssgen MJ. Satellite-aided survey sampling and implementation in low- and middle-income contexts: a low-cost/low-tech alternative. Emerg Themes Epidemiol. 2015;12(1):20.
Chaix B, Kestens Y, Duncan DT, Brondeel R, Méline J, El Aarbaoui T, et al. A GPS-based methodology to analyze environment-health associations at the trip level: case-crossover analyses of built environments and walking. Am J Epidemiol. 2016;184(8):579–89.
Griffith DA. Uncertainty and context in geography and giscience: reflections on spatial autocorrelation, spatial sampling, and health data. Ann Am Assoc Geogr. 2018;108(6):1499–505.
Dureau F. Utiliser la télédétection spatiale pour observer les populations citadines. Villes et citadins du Tiers Monde. Bondy: ORSTOM; 1990.
Kondo MC, Bream KDW, Barg FK, Branas CC. A random spatial sampling method in a rural developing nation. BMC Public Health. 2014;14(1):338.
Theron G, Jenkins HE, Cobelens F, Abubakar I, Khan AJ, Cohen T, et al. Data for action: collection and use of local data to end tuberculosis. Lancet. 2015;386(10,010):2324–33.
Bengtsson L, Lu X, Thorson A, Garfield R, von Schreeb J. Improved response to disasters and outbreaks by tracking population movements with mobile phone network data: a post-earthquake geospatial study in Haiti. PLOS Med. 2011;8(8):e1001083.
Wilson R, Zu Erbach-Schoenberg E, Albert M, Power D, Tudge S, Gonzalez M, et al. Rapid and Near Real-Time Assessments of Population Displacement Using Mobile Phone Data Following Disasters: The 2015 Nepal Earthquake. PLoS Curr. 2016. https://doi.org/10.1371/currents.dis.d073fbece328e4c39087bc086d694b5c.
Shannon HS, Hutson R, Kolbe A, Stringer B, Haines T. Choosing a survey sample when data on the population are limited: a method using Global Positioning Systems and aerial and satellite photographs. Emerg Themes Epidemiol. 2012;9(1):5.
Galway LP, Bell N, Sae AS, Hagopian A, Burnham G, Flaxman A, et al. A two-stage cluster sampling method using gridded population data, a GIS, and Google EarthTM imagery in a population-based mortality survey in Iraq. Int J Health Geogr. 2012;11(1):12.
Beletsky L, Arredondo J, Werb D, Vera A, Abramovitz D, Amon JJ, et al. Utilization of Google enterprise tools to georeference survey data among hard-to-reach groups: strategic application in international settings. Int J Health Geogr. 2016;15(1):24.
Pearson AL, Rzotkiewicz A, Zwickle A. Using remote, spatial techniques to select a random household sample in a dispersed, semi-nomadic pastoral community: utility for a longitudinal health and demographic surveillance system. Int J Health Geogr. 2015;14(1):33.
Lin Y, Kuwayama DP. Using satellite imagery and GPS technology to create random sampling frames in high risk environments. Int J Surg. 2016;32:123–8.
Acknowledgements
The authors wish to thank Pr Mark Moritz from the OSU (USA), Dr Roland Ziebe from the University of Maroua (Cameroun) and Jessica Healy from the Institut National de Santé Publique du Québec (Canada) for their helpful discussion during methodology design. We thank Dr Mohaman Arabi from the University of Maroua (Cameroon) for the update and scanned topographic sheet of Maroua and Mme Veronique Houli from the MINEPIA (Cameroon) for her contribution during field work.
Disclaimer
Reference in the manuscript to any specific commercial product, process or service by the trade name, trademark, manufacturer or otherwise does not necessarily constitute or imply its endorsement, recommendation or favouring by the authors or the entities they are affiliated to, and shall not be used for commercial advertising or product endorsement purposes.
Funding
This work was funded by the National Sciences Foundation [DEB-1015908] via the fellowship of the Disease Ecology and Computer Modeling Laboratory of the Ohio State University (OH, USA).
Author information
Authors and Affiliations
Contributions
RRBNV, APZ and RG conceived the study. SC conducted the spatial data frame in Google Earth. RRBNV conducted the random sample selection and mapping. SC conducted the survey in the field supervised by ASD and BG. RRBNV and SC drafted the manuscript. All authors read and approved the final manuscript.
Corresponding author
Ethics declarations
Ethics approval and consent to participate
Not applicable.
Consent for publication
Not applicable.
Competing interests
The authors declare that they have no competing interests.
Additional information
Publisher's Note
Springer Nature remains neutral with regard to jurisdictional claims in published maps and institutional affiliations.
Rights and permissions
Open Access This article is distributed under the terms of the Creative Commons Attribution 4.0 International License (http://creativecommons.org/licenses/by/4.0/), which permits unrestricted use, distribution, and reproduction in any medium, provided you give appropriate credit to the original author(s) and the source, provide a link to the Creative Commons license, and indicate if changes were made. The Creative Commons Public Domain Dedication waiver (http://creativecommons.org/publicdomain/zero/1.0/) applies to the data made available in this article, unless otherwise stated.
About this article

Cite this article
Ngom Vougat, R.R.B., Chouto, S., Aoudou Doua, S. et al. Using Google Earth™ and Geographical Information System data as method to delineate sample domains for an urban household surveys: the case of Maroua (Far North Region-Cameroon). Int J Health Geogr 18, 22 (2019). https://doi.org/10.1186/s12942-019-0186-8
Received:
Accepted:
Published:
DOI: https://doi.org/10.1186/s12942-019-0186-8